This section presents monitoring graphs and historical data for both established and pending connections of the active farm across four different time frames: the last day, last week, last month, and last year.
Here’s an overview of the connections:
Established. These are confirmed connections marked as ESTABLISHED. For GSLB farms, this indicates DNS requests receiving responses from the backends.
Pending. These are connections to the GSLB farm awaiting responses from the backends. An increased rate indicates more requests that have not been served.
Each graph displays the following metrics:
- Last: The most recent value gathered.
- Minimum: The lowest recorded value within the selected time frame.
- Maximum: The highest recorded value within the selected time frame.
- Average: The average value calculated over the selected time frame.
For more detailed insights, please refer to the accompanying images below.
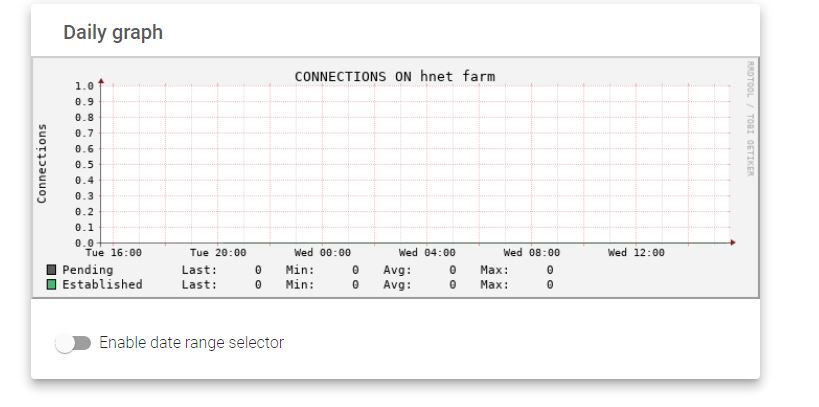
Daily graphs #
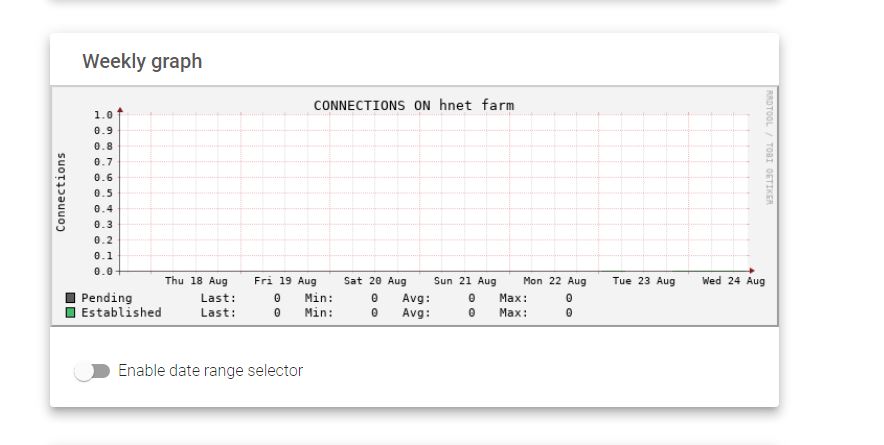
Weekly graphs #
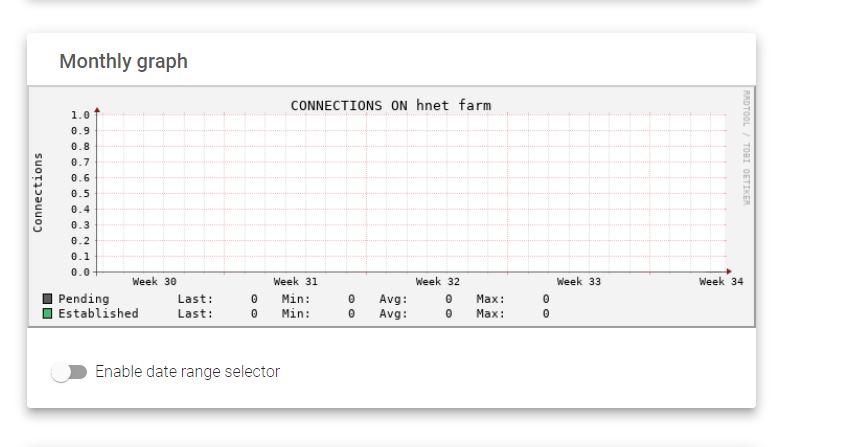
Monthly graphs #
Yearly graphs #
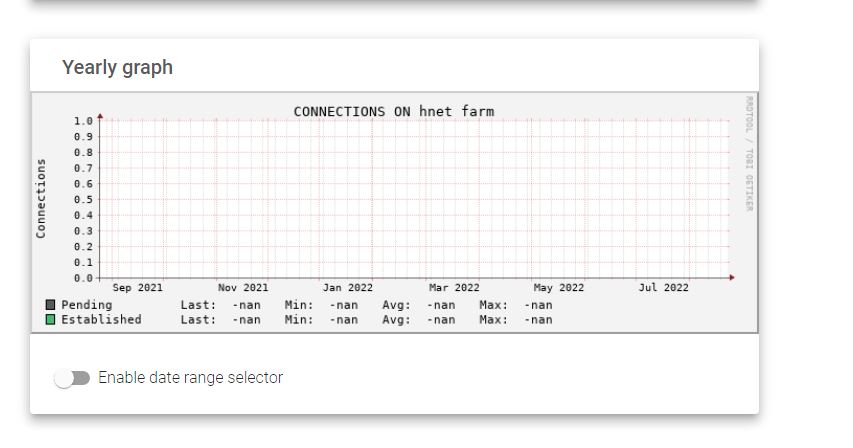
Note: You can choose a range of statistical data by activating the Enable data range selector button.
Next step, see the GSLB backends stats.


